2025 Sterile Processing State of the Industry Report: Executive Summary
Pure Processing’s annual report captures what sterile processing teams are seeing across the United States. This year’s survey includes ![]() 732 participants and remains 100% anonymous. Below are the major themes and highlights for 2025.
732 participants and remains 100% anonymous. Below are the major themes and highlights for 2025.
About the participants
Roles represented include technicians, managers, supervisors, lead techs, educators, directors or chiefs, coordinators, and others, with a near even split in GI experience. Certification levels remain high, led by CRCST, with many holding additional credentials.
Entering the industry
Pathways into SPD include moving from another department 28.83%, referrals 19.81%, pursuing SPD education 10.25%, armed services experience 5.19%, and job fairs 3.55%. The largest single group found an opening with no prior SPD knowledge 32.38%. Combined, 60.00% entered via internal moves, referrals, or deliberate pursuit of SPD.
What SPD professionals enjoy about the work
Respondents emphasized helping patients and making a difference, contributing to surgery and patient safety, hands-on technical work, teamwork, learning and continuous education, pride and purpose, and job stability.
Problems departments face
Top problems reported were Pay and Benefits 71.11%, Space 51.80%, Equipment 41.62%, Training and Education 40.72%, Work Culture 32.04%, Management 25.15%, Compliance 14.97%, Visual Inspection 12.43%, and Ergonomics 10.18%.
What should be easy to fix
Participants pointed to quick wins in Workplace Culture and Professional Respect 28%, Training and Education 22%, Pay and Benefits 21%, Equipment and Preventive Maintenance 12%, Communication, Teamwork and Management Support 12%, and Compliance and Standards 5%.
Most important problems to solve
Equipment Issues 22.70% topped the list of priorities, followed by Training, Education and Competency at 15.40%, Pay and Benefits at 15.00%, Culture and Work Environment 14.00%, Leadership, Communication and Accountability 8.80%, Space and Layout 8.60%, Staffing, Retention and Compensation 8.20%, and IFUs, Compliance and Policies 7.40%. Culture-related responses showed the highest frustrated sentiment share within this group.
Departmental ratings snapshot
Average ratings were Compliance 6.9, Leadership 6.7, Visual Inspection 6.7, Workflow and Processes 6.5, Work Environment 6.5, Technology 6.4, Ergonomics and Technician Comfort 6.3, Culture 6.0, and Training and Education 6.0. Several categories had double-digit shares of respondents rating them excellent, while poor ratings were less common.
Education trends
Top resources remain in-services 71.92%, HSPA resources 76.90%, publications 61.20%, vendor programs 34.74%, local chapter events 25.16%, social media 17.53%, and local colleges 7.47%. Influence matters: where an Educator leads, Training and Education scores are higher than where a Manager, Director, or Supervisor is most influential. Reported averages were Educator 6.5, Manager 6.0, Director 6.3, and Supervisor 5.8.
What makes a department great to work in
Five themes stood out: supportive team and camaraderie 40%, sense of purpose and pride in patient safety 34%, respectful and supportive leadership 26%, resources and reliability 16%, and growth, training and development 8%.
Why people leave aside from compensation
Top reasons included lack of appreciation 29.71%, management style 14.61%, physical demands 15.42%, lack of upward mobility 15.26%, work and life balance 9.58%, lack of accountability 9.58%, and the nature of the work 5.84%. Even so, 86.85% would recommend a career in sterile processing.
Safety and injuries
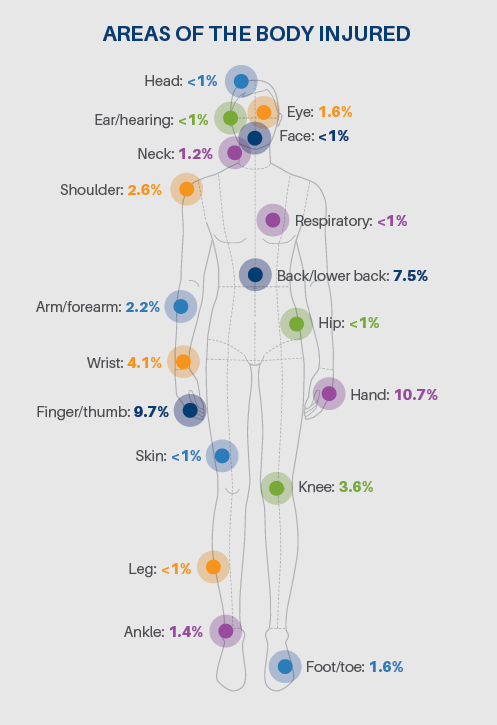
41.43% reported being injured at some point in their SPD career. Common injury types included cuts and lacerations 17.4%, strains and sprains 8.3%, and burns 5.7%. Mechanisms included sharps handling 11.4%, lifting or moving heavy items 7.1%, and hot equipment or steam 4.1%.
Record-keeping and AI adoption
Record-keeping methods included pen and paper 35.58%, digital 15.22%, and a combination 49.20%. Compared to 2024, pen and paper usage dropped by roughly 4 percentage points, and digital rose by just over 4. AI adoption was reported by 7.85% of departments, with use cases spanning tracking integration, inventory management, inspection technology software, analytics and reporting, writing SOWs and SOPs, tray assembly, content creation, and task management.
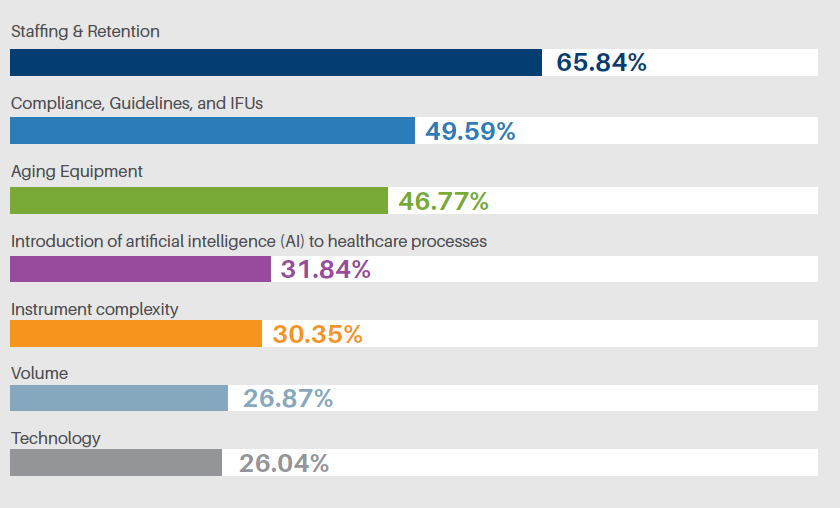
Looking ahead
Participants expect continued pressure around Staffing and Retention 65.84%, Compliance, Guidelines and IFUs 49.59%, and Aging Equipment 46.77%, along with AI introduction 31.84%, instrument complexity 30.35%, volume 26.87%, and technology 26.04%.
Thank you to everyone who contributed. Your input helps departments benchmark, plan, and improve.
Click here to read the full report, explore all the insights, and earn 1 Free CE.