Don’t Let the Work Around Become the Workflow – Optimizing Your Department with Data
Our Voice of the Customer (VOC) council convened earlier this spring to discuss a topic on the minds of many sterile processing department managers, but not necessarily at the forefront of current conversations: data.
If you missed the first VOC blog post on data, Studying Your Department: Where to Start and How to Gather Data, be sure to check it out!
Once a department has established how to consistently collect reliable data, it’s time to put it to use. A great place to start is addressing workarounds that have become standardized within a department’s workflow.
Common Workarounds That Become Commonplace
Often, departments may not even realize that a workaround to a solution has become standard practice in their department. Here are some common examples of workarounds that can become permanent if not stamped out:
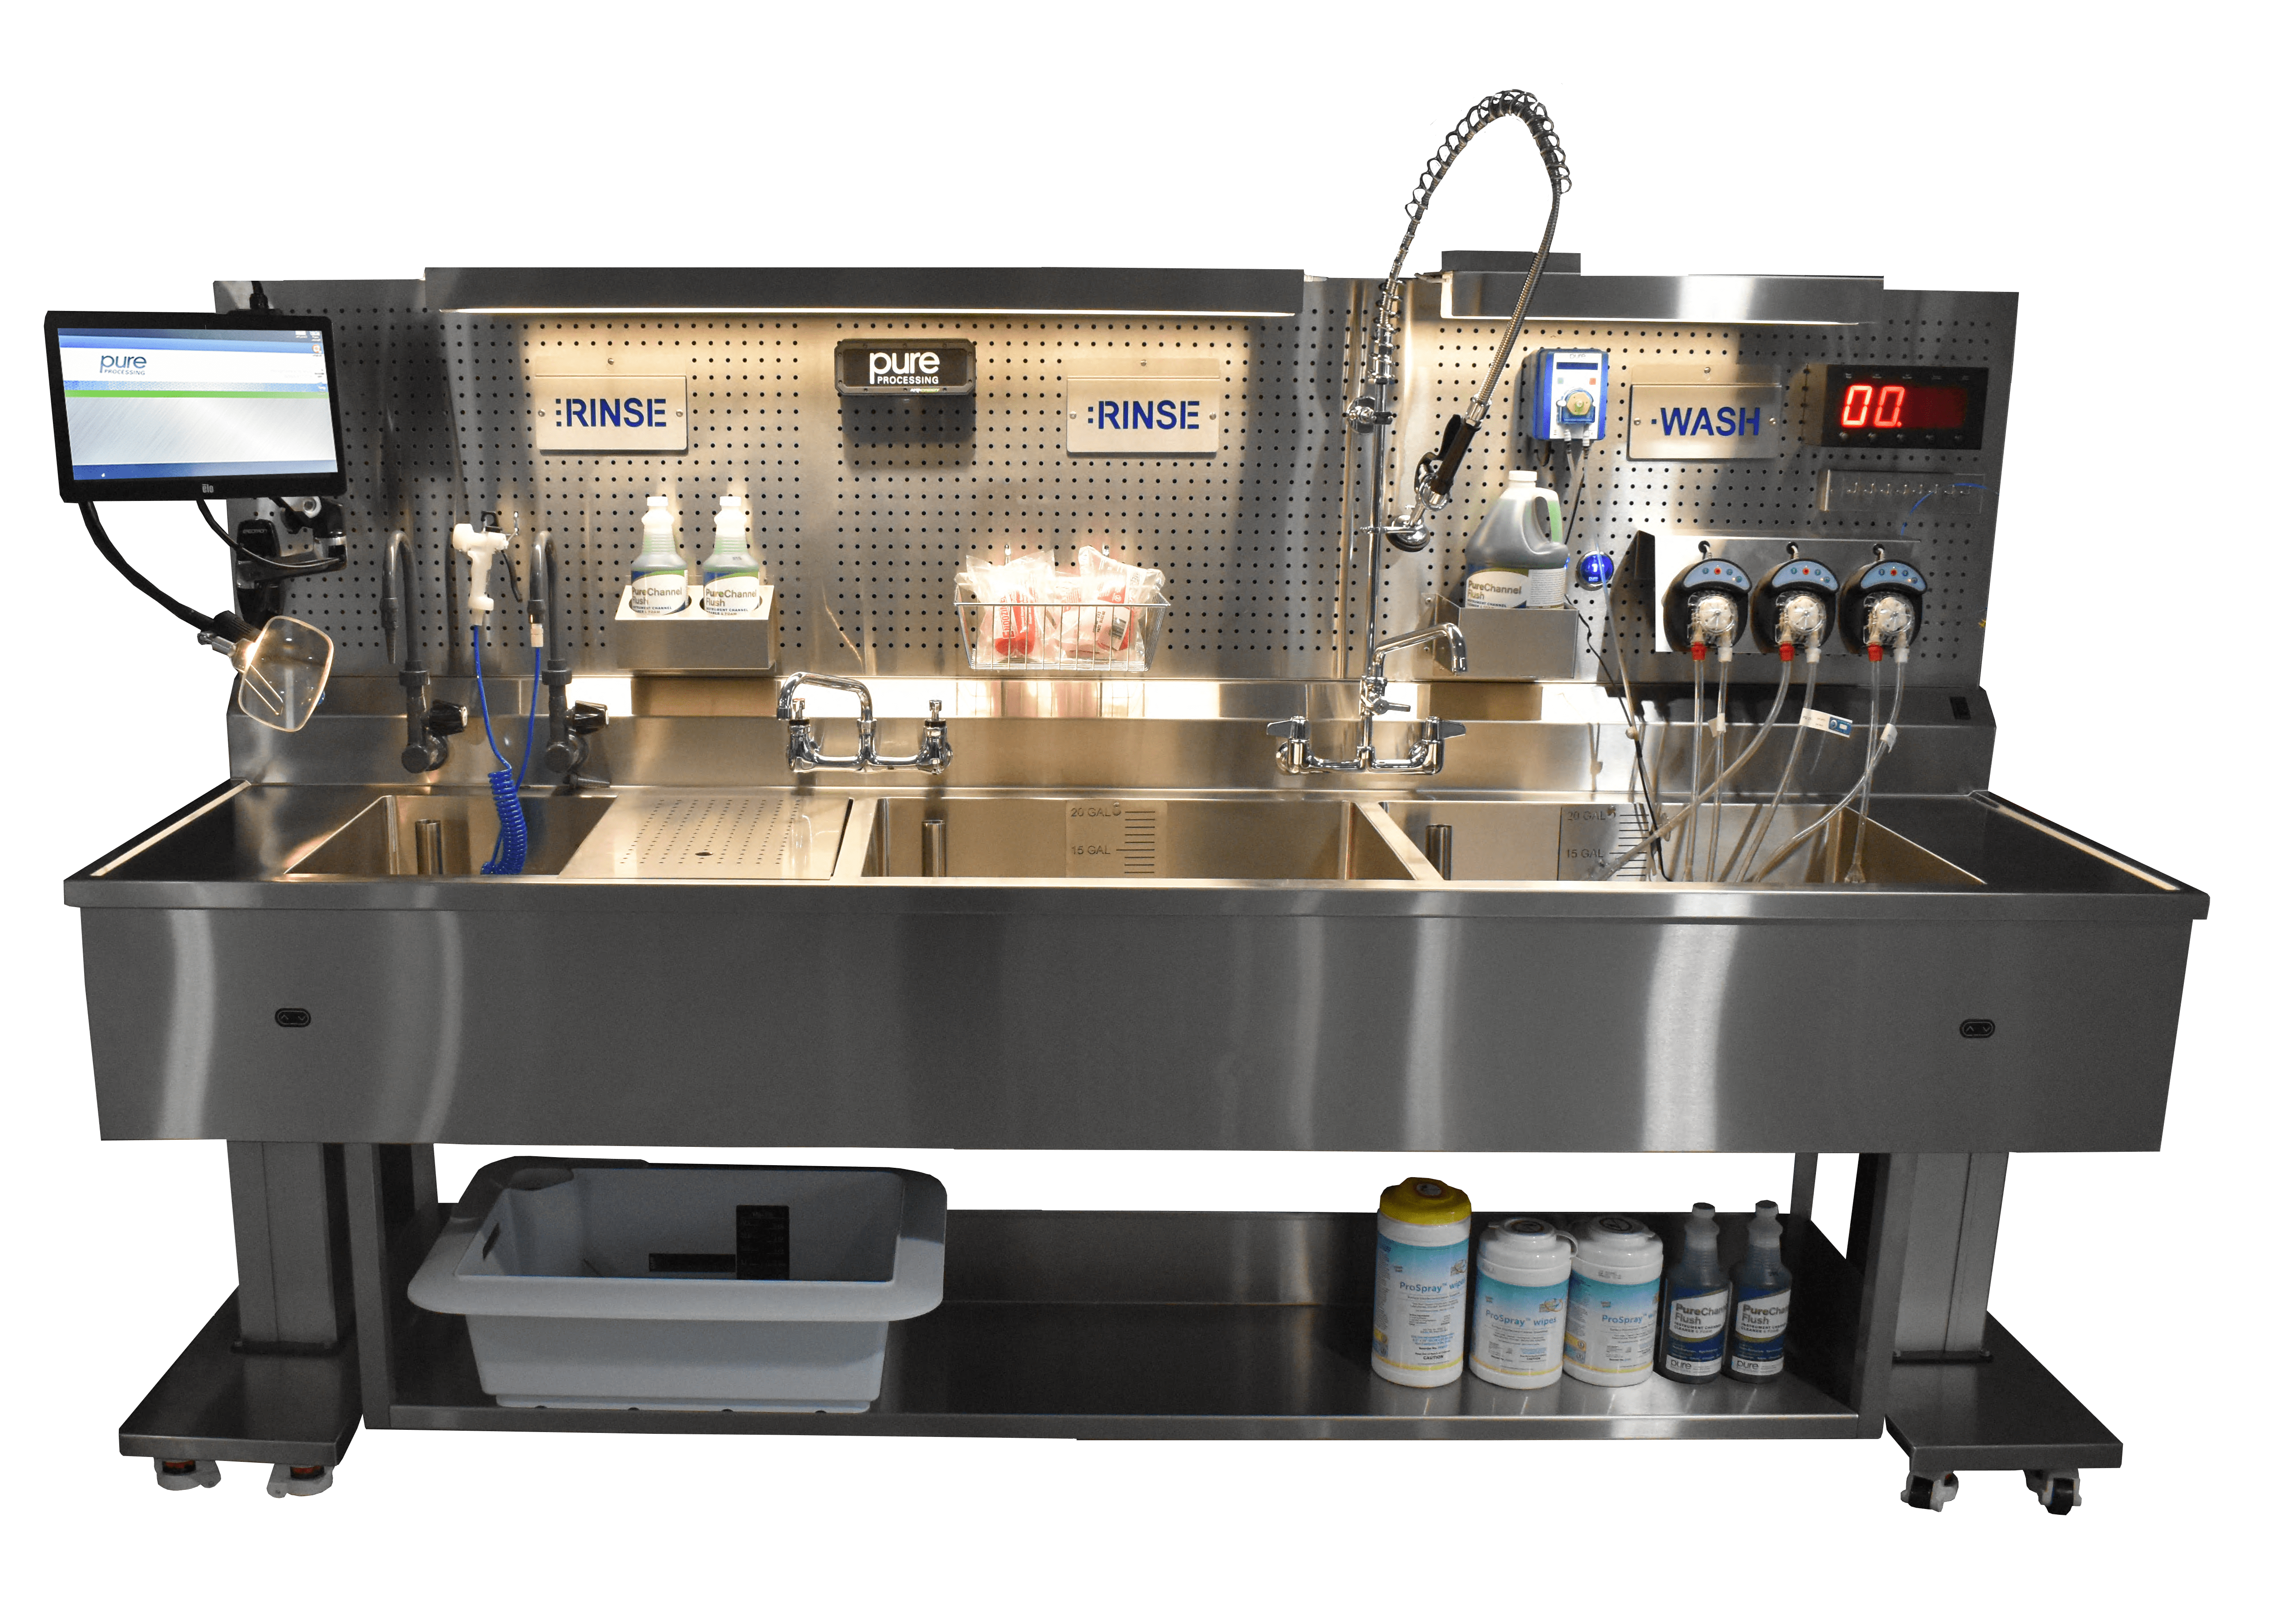
- Shortened soaking times – Without a timer at the sink, it can be easy for instrument soak times go too long, or not long enough, to meet IFU requirements.
- Eliminated soaking times – In some instances, particularly when technicians are rushed or lack adequate understanding of the importance of soaking, soaking time can be eliminated entirely, believing that later cleaning will be sufficient.

- Flushing requirements not being met – IFUs that call for specific flushing requirements, such as 60 seconds, can be difficult to meet when syringe flushing, even with a timer. Because the syringe needs to be filled, attached, and emptied, ensuring flushing requirements are met can prove challenging.
- Testing – Certain tests, such as checking insulation, can sometimes be skipped due to a lack of tools. If two techs are required to share a single insulation testing machine, it can become common for whomever isn’t actively using the machine to skip the test in favor of completing their tray faster, or due to impatience.
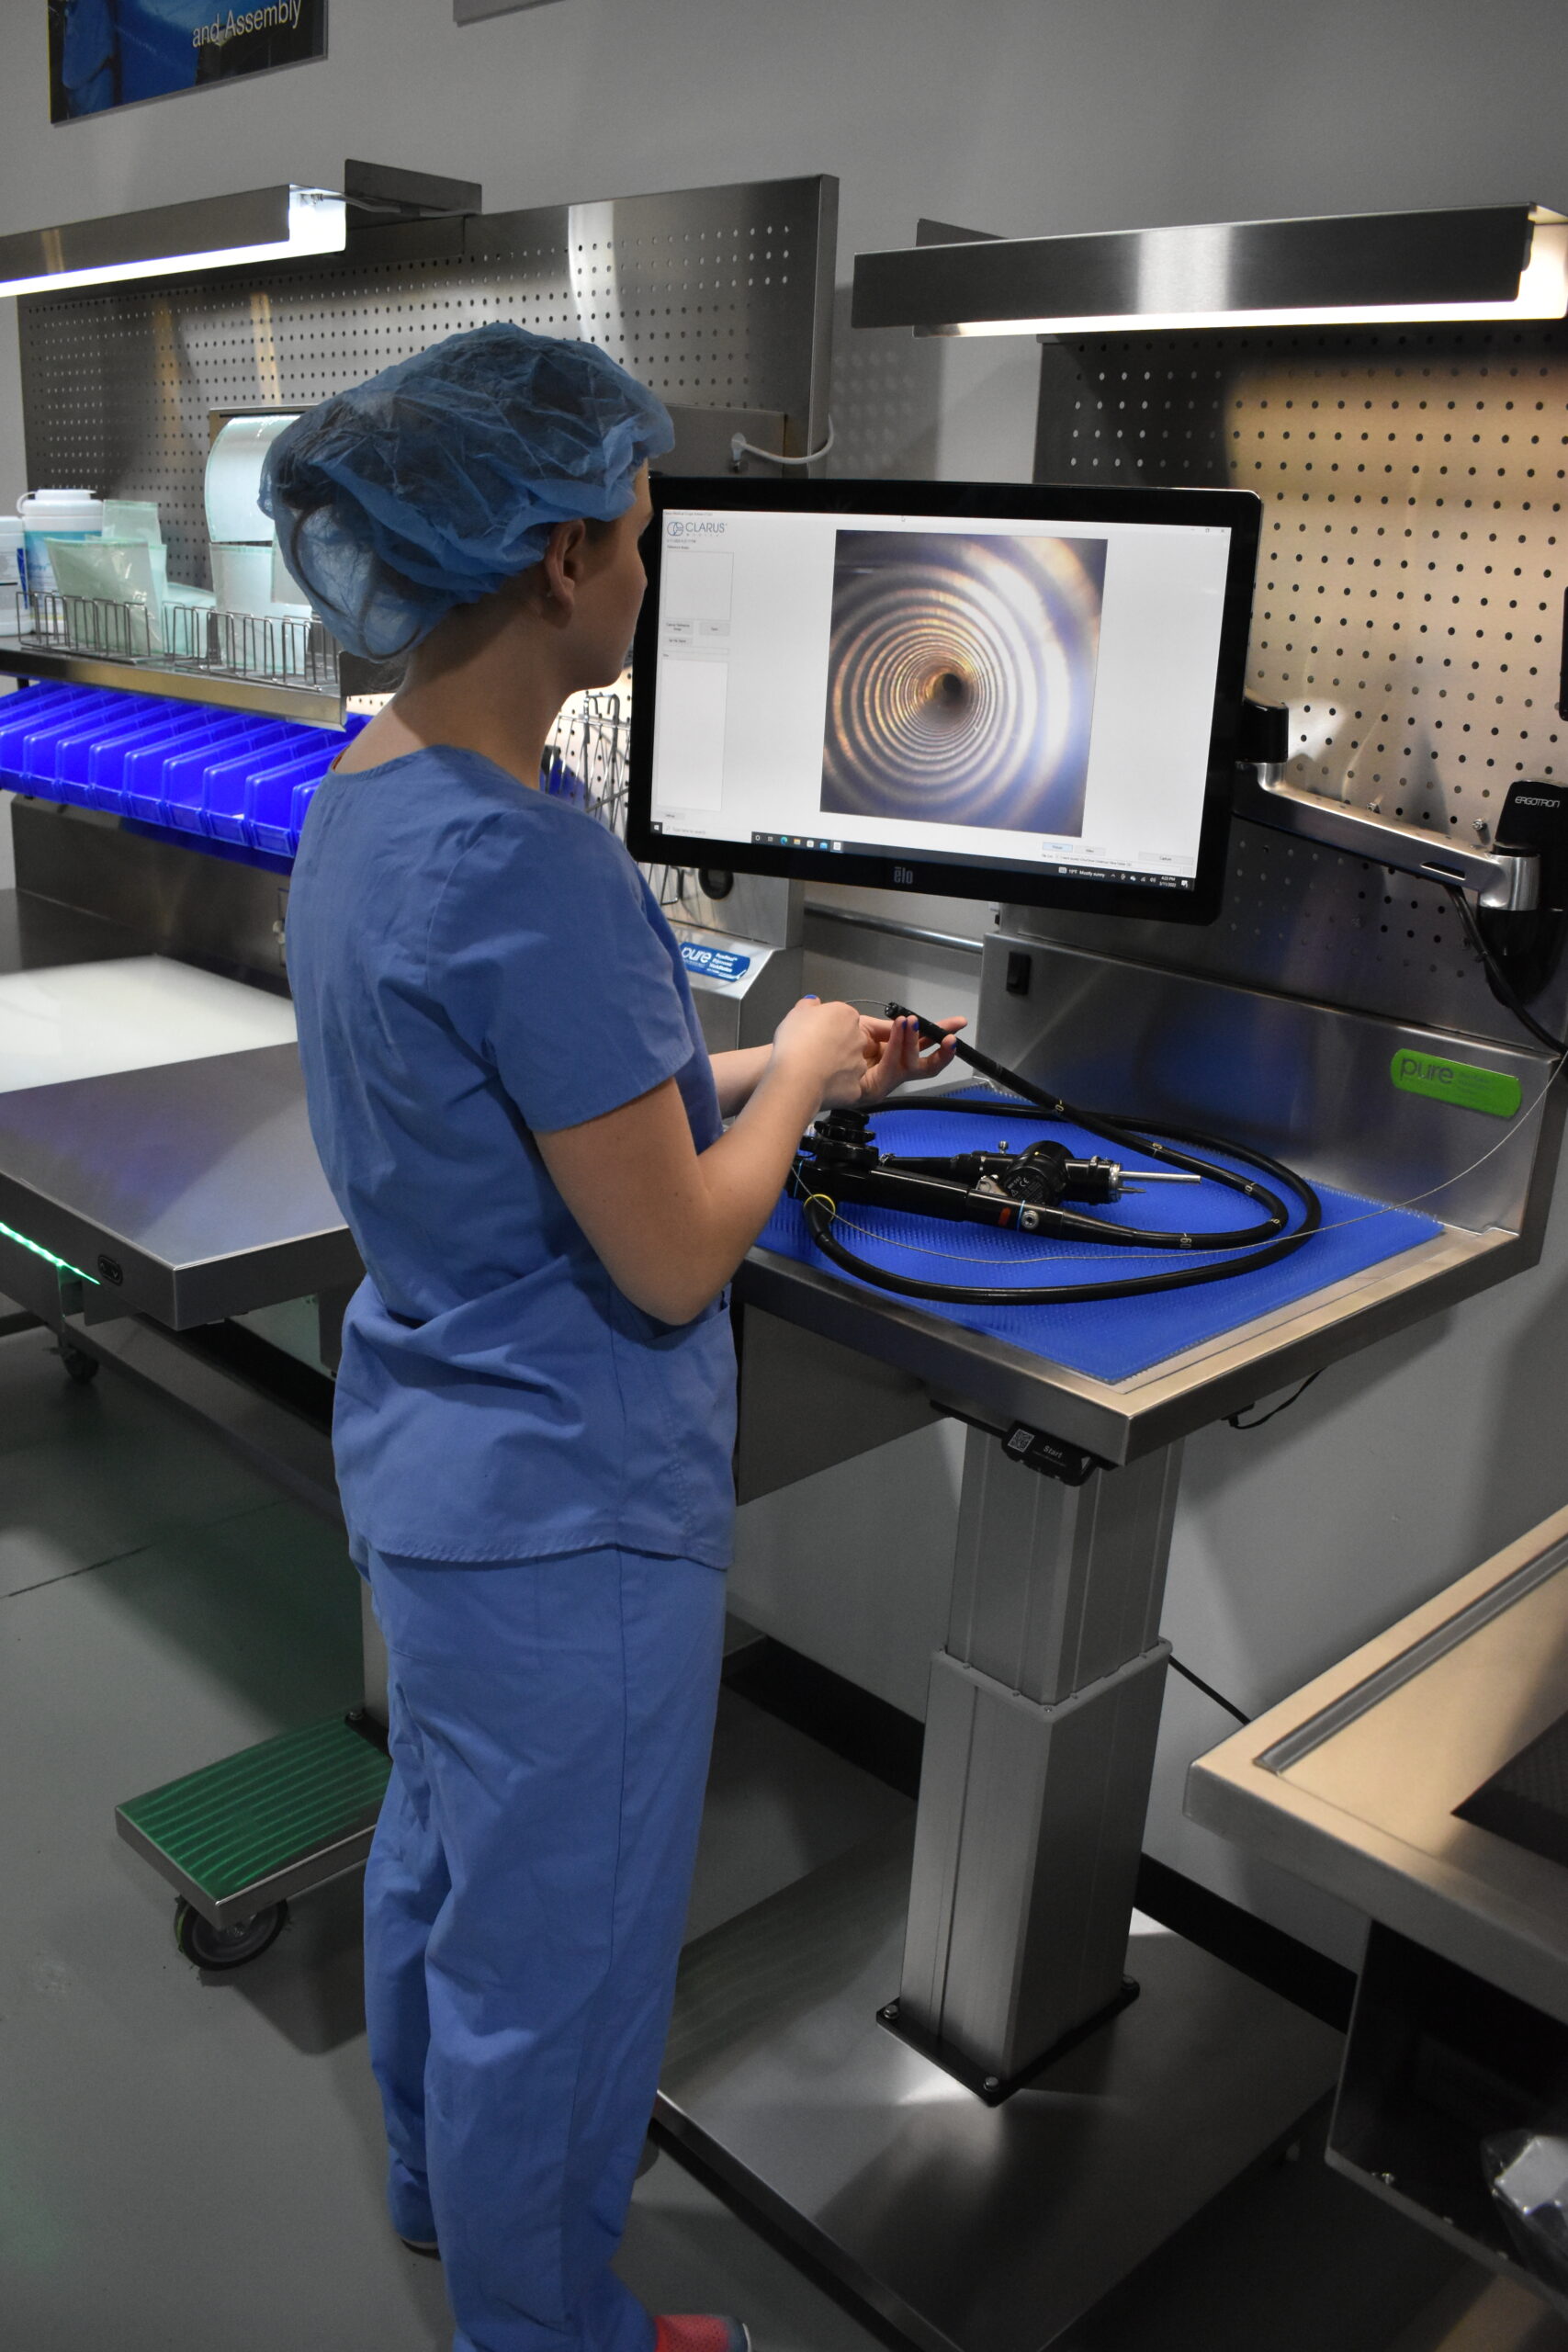
- Visual Inspection – Limited availability or complexity of borescope systems can cause some departments to skip internal visual inspections.
The Consequences of Standardizing Shortcuts
Taking shortcuts in sterile processing leads to numerous negative consequences. For example:
- Patient safety – Any time that an IFU isn’t followed, or a test is missed, patient safety is compromised.
- Damage & repair – Mishandled devices are more likely to get damaged, leading to costly repairs and a lack of availability for the OR.
- Bioburden build-up – When instruments aren’t properly reprocessed according to their IFU, bioburden and excess chemicals can build up, leading to premature wear and failure, reducing the useful life of your device inventory.
- Reputation – When shortcuts are taken in SPD, they’re often felt in the operating room. Over time, errors associated with workarounds and shortcuts can erode the sterile processing department’s reputation and communication with their partners in the OR.
- Turnover – When dedicated CS staff see their coworkers cutting corners and working with less care then they do, it can cause resentment and distrust, and ultimately the resignation of great employees. One negative employee can ruin the experience of many.
How to Use Data to Identify Challenges
Good data can turn intuition into truth, and further into action. Good data can often identify challenges in reprocessing departments, such as:
Frequency of processing
How many times per month is a tray type being processed?
Using an Overbooked Inventory report, coupled with information of the number of times the tray couldn’t be properly supplied, you can figure out where you need to bolster inventory or processes.
Actual data from our VOC participants:
- One tray was requested 30 times in a month. The department was unable to supply it twice.
- If there are 10 or more instances where the request couldn’t be met, the issue escalates to managerial level and prompts a request to expand inventory.
Turnaround times
How often are we asked to expedite trays?
Expedited trays are prone to errors, meaning that they’re a good target for quality assurance (QA) audits. Seeing high volumes of expedited requests for a specific tray type lets you know where to focus your efforts in training and materials.
Data that demonstrates consistent quick turnaround requests for specific trays can be used to justify the expansion of your inventory to better meet the ORs needs.
Inventory without history report
How much inventory do we have that’s been aged out of use?

Using a report to assess how often every tray type has been used can help departments streamline and optimize their inventory. If a tray has only been reprocessed once a year for the last three years, it is likely only getting reprocessed per department policy. This often happens when a physician that requested the tray leaves the hospital or begins using different or newer instruments. Data associated with inventory and tray usage can help departments justify the removal of certain trays, reducing annual workload, optimizing inventory, and freeing up space for tray types the department needs more of.
Equipment Usage
How often is my critical equipment being utilized?
During one VOC member’s example, equipment usage reports indicated only one of three functioning sterilizers was ever being used. The department’s productivity was bottle-necked to 33% total sterilizer output.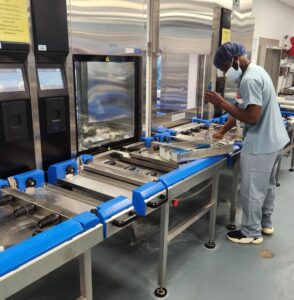
Recognizing this as an artificial bottleneck, the SPD manager investigated why technicians were only using one sterilizer, as opposed to all three. The technicians explained that this sterilizer was in an optimal position for the department’s workflow and was easiest to access and use.
After making all the tools accessible at the other two sterilizers, technicians began using them more often, which alleviated the bottleneck and improved the department’s productivity significantly.
Individual Performance
How are specific team members contributing to output?
If a technician goes from 536 trays one month, down to 330 trays the next, managers can definitively identify performance has been affected. Training needs may be identified, or factors impacting performance stemming from outside the workplace can be identified & discussed.
Moving forward
Having explored ways data can be used to identify and resolve problems in your department, it’s time to build a meaningful scorecard. Scorecards provide consistent assessment against benchmarks, turning data from noise, into indicators of health. Be on the lookout for our next blog post: “Department scorecards and metrics: What to measure and how to build meaningful scorecards”
About: Voice of the Customer Committee
The Voice of the Customer Committee is a panel of healthcare and instrument reprocessing professionals who have graciously donated their time to share their expertise and guidance on current challenges faced by the instrument reprocessing community. Through sharing their insights, experiences, and best practices, we have been given the opportunity to share these findings with our readership. We’d like to thank our VOC members for their outstanding input and insights, as well as their time! Thank you for your continued partnership, and all you do.

